INPEX safety shortcuts exposed Ichthys LNG workers and ocean to mercury
INPEX bypassed equipment and ignored procedures agreed with the regulator that together were meant to keep the toxic metal contained.
INPEX bypassed equipment and ignored procedures agreed with the regulator that together were meant to keep the toxic metal contained.

Asia's fossil fuel industry readies to once again talk up carbon capture and storage (CCS) as the technology that lets us keep burning coal and gas, while still hitting our climate targets.
The US company will have a monopoly over WA bauxite mining and alumina refining, which it plans to operate for 40 years.
WA's industrial greenhouse gas emissions are dominated by four products and a handful of companies, including a few that have managed to keep a low profile in the climate wars.

EXCLUSIVE ANALYSIS
Three major exports and local power account for 85 per cent of the carbon pollution from large facilities in WA, with LNG the dominant emitter of greenhouse gases.
Boiling Cold has analysed Clean Energy Regulator data for industrial facilities and power stations emitting more than the equivalent of 100,000t of CO2 in the 2019-20 financial year. The data excludes agriculture, vehicle emissions, small facilities, and some other emission sources.
Five LNG plants in WA produced 20.6 million tonnes of carbon pollution in the 12 months to June 2020. Inpex's Ichthys project off WA would have topped the list at 7.6 million tonnes of CO2e but was excluded as the gas is piped to shore at Darwin.
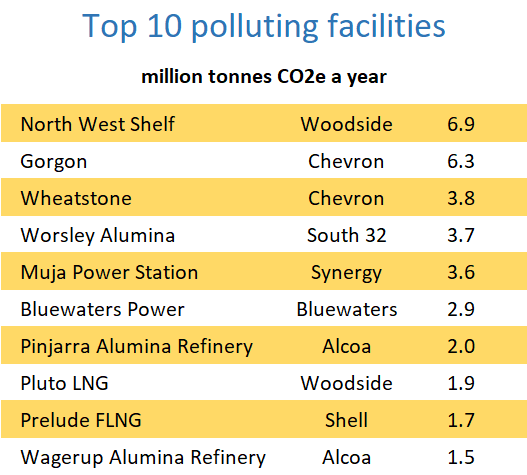
Woodside's ageing North West Shelf LNG plant is WA's biggest emitter, overtaking Chevron's Gorgon that reduced annual emissions from 9.0 million tonnes to 6.3 million tonnes after starting its carbon dioxide injection system in August 2019.
State-owned Synergy's Muja power station and Sumitomo and Kansai Electric's nearby Bluewaters showed the significant carbon impact of burning Collie's coal.
LNG and Collie's coal-fired power supply to the grid attracts most attention when WA greenhouse gas emissions are discussed. However, South32's largely coal-powered Worsley Alumina operation produced more carbon pollution than the Pluto and Prelude LNG projects combined.
WA's most significant export iron ore is absent from the top 10 most polluting facilities as the big miners' operations sprawl over many locations recorded separately by the Clean Energy Regulator.
The big two of iron ore – BHP and Rio Tinto - feature when emissions are grouped by company.
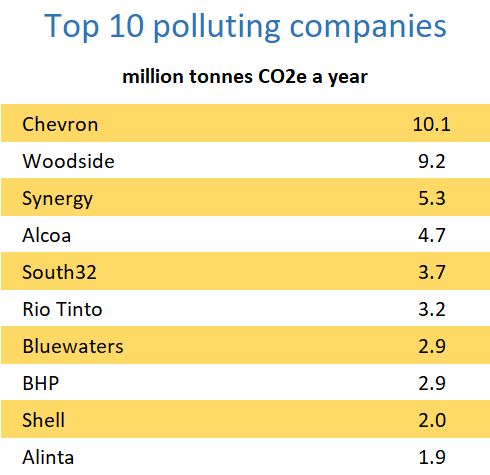
Chevron tops the list as operator of the Gorgon and Wheatstone LNG plants. Emissions were allocated to the operators of facilities, not by ownership. Woodside, for example, is assigned all the emissions from the Pluto and North West Shelf projects it operates, but not the emissions from the share of Wheatstone it owns.
Chevron is unlikely to be helping the WA Government reach its net-zero emissions by 2050 target any time soon.
The LNG giant recently failed most elements of a scorecard of climate change preparedness by the international investor group Climate Action 100+.
The US oil and gas major leading WA carbon pollution was red-carded on its net-zero emissions by 2050 ambition, emissions reduction targets and the lack of a strategy to decarbonise.
Alcoa's emissions come from three alumina refineries and an allocation of one-third of the emissions from Alinta's gas-fired cogeneration plant that supplies Alcoa's Pinjarra refinery with steam.
Power retailer and generator Synergy has so far escaped the ire of climate protesters directed to the two LNG companies above it on the list of top polluters. As well as Muja, the utility has the Collie power station and a swag of gas-fired units. Its prominence shows the WA Government has substantial emissions under its direct control if it wanted to demonstrate a real commitment to its target of net-zero emissions in WA by 2050.
Shell features as operator of the troubled Prelude floating LNG vessel. Prelude's previous financial year was a carbon disaster with 2.3 million tonnes of greenhouse gases for just one cargo of LNG.
When the facilities are tallied by commodity, the production of LNG, power, iron ore and alumina dominate WA's industrial carbon footprint. The tally allocated power stations specific to an industry to that sector and other stations to power generation.
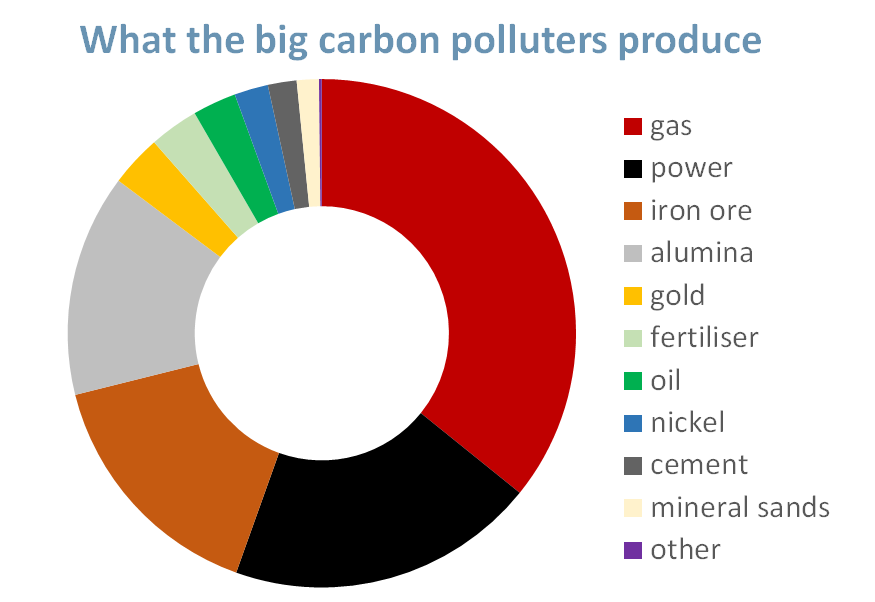
Iron ore, oil and gas, gold, and alumina produced 94 per cent of the value of WA's resources output in 2019-2020, according to the Department of Mines, Industry Regulation and Safety's WA Mineral and Petroleum Statistics Digest.
The contribution of gold to WA's emissions is likely to be understated in the emissions figures as much production is from mines that emit less than 100,000 tones of CO2e a year and do not have to report to the Clean Energy Regulator. The other three major exports revenue streams emit vastly different amount of carbon pollution to produce revenue.
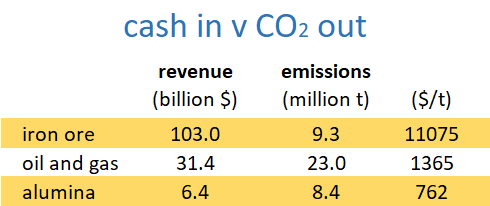
South32 and Alcoa's alumina operations are the most dependent on emitting greenhouse gases to make money: twice as intense as the higher-profile LNG sector.
Carbon offsets at the current price of about $17 a tonne would take away about two per cent of the alumina sector's revenue.
The iron ore sector's revenue is the least carbon-intensive, but total emissions are significant because of the industry's vast size.
Correction 29 April: The initial analysis incorrectly allocated all emissions from Alinta's power plants near Alcoa's Pinjara and Wagerup refineries to Alcoa. These plants supply no power to Alcoa but the Pinjarra plant does provide process steam. Also, some small regional power stations were counted twice, slightly affecting some sector and company totals.

Asia's fossil fuel industry readies to once again talk up carbon capture and storage (CCS) as the technology that lets us keep burning coal and gas, while still hitting our climate targets.

The US company will have a monopoly over WA bauxite mining and alumina refining, which it plans to operate for 40 years.

Australia's safeguard mechanism is failing to reduce emissions because major polluters are relying on unlimited carbon offsets, according to The Australia Institute.

Australian taxpayers pay $5 billion a year to miners, including highly profitable giants like BHP.
All the info and a bit of comment on WA energy, industry and climate every Friday